Foundation of Data Science: Unit III: Describing Relationships
Correlation Coefficient for Quantitative Data
Properties, Formula, Example Solved Problems | Data Science
The product moment correlation, r, summarizes the strength of association between two metric (interval or ratio scaled) variables, say X and Y.
Correlation Coefficient for
Quantitative Data
• The product moment correlation, r,
summarizes the strength of association between two metric (interval or ratio
scaled) variables, say X and Y. It is an index used to determine whether a
linear or straight-line relationship exists between X and Y.
• As it
was originally proposed by Karl Pearson, it is also known as the Pearson
correlation coefficient. It is also referred to as simple correlation,
bivariate correlation or merely the correlation coefficient.
• The
correlation coefficient between two variables will be the same regardless of
their underlying units of measurement.
• It
measures the nature and strength between two variables of the quantitative
type.
• The
sign of r denotes the nature of association. While the value of r denotes the
strength of association.
• If the
sign is positive this means the relation is direct (an increase in one variable
is associated with an increase in the other variable and a decrease in one
variable is associated with a decrease in the other variable).
• While
if the sign is negative this means an inverse or indirect relationship (which
means an increase in one variable is associated with a decrease in the other).
• The
value of r ranges between (-1) and (+ 1). The value of r denotes the strength
of the association as illustrated by the following diagram,
1. If r
= Zero this means no association or correlation between the two variables.
2. If 0
< r <0.25 = Weak correlation.
3. If
0.25 ≤
r <
0.75 = Intermediate correlation.
4. If
0.75 ≤ r< 1
= Strong correlation.
5. If
r=1= Perfect correlation

• Pearson's
'r' is the most common correlation coefficient. Karl Pearson's Coefficient of
Correlation denoted by - 'r' The coefficient of correlation 'r' measure the
degree of linear relationship between two variables say x and y.
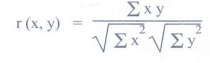
•
Formula for calculating correlation coefficient (r) :
1. When
deviation taken from actual mean :
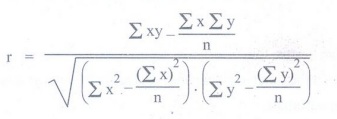
2. When
deviation taken from an assumed mean :
Example
3.3.1: Compute Pearson's coefficient of correlation between maintains cost and
sales as per the data given below.
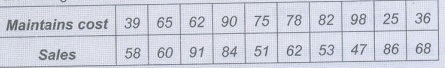
Solution: Given data:
n= 10
X=
Maintains cost
y=Sales
cost
Calculate
coefficient of correlation.

Correlation
coefficient is positively correlated.
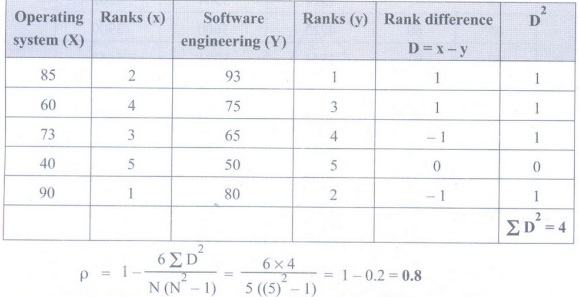
Example 3.3.2: A random sample of 5 college
students is selected and their grades in operating system and software
engineering are found to be ?
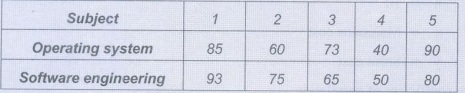
Calculate
Pearson's rank correlation coefficient?
Solution:
Example 3.3.3: Find Karl Pearson's correlation
coefficient for the following paired data.
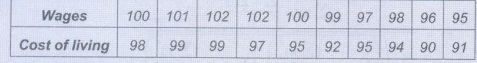
Solution: Let
x =
Wages y = Cost of living

Karl Pearson's correlation coefficient r = 0.847
Example 3.3.4: Find Karl Pearson's correlation
coefficient for the following paired data.
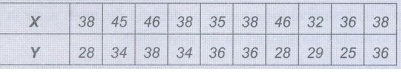
What
inference would you draw from estimate ?
Solution:

Foundation of Data Science: Unit III: Describing Relationships : Tag: : Properties, Formula, Example Solved Problems | Data Science - Correlation Coefficient for Quantitative Data
Related Topics
Related Subjects

Foundation of Data Science
CS3352 3rd Semester CSE Dept | 2021 Regulation | 3rd Semester CSE Dept 2021 Regulation