Foundation of Data Science: Unit III: Describing Relationships
Correlation
Types, Coefficient, Properties, Example Solved Problems | Data Science
When one measurement is made on each observation, uni-variate analysis is applied.
UNIT III : Describing Relationships
Syllabus
Correlation
- Scatter plots - correlation coefficient for quantitative data - computational
formula for correlation coefficient - Regression - regression line - least
squares regression line - Standard error of estimate - interpretation of R2
- multiple regression equations - regression towards the mean.
Correlation
• When
one measurement is made on each observation, uni-variate analysis is applied.
If more than one measurement is made on each observation, multivariate analysis
is applied. Here we focus on bivariate analysis, where exactly two measurements
are made on each observation.
• The
two measurements will be called X and Y. Since X and Y are obtained for each
observation, the data for one observation is the pair (X, Y).
• Some examples :
1.
Height (X) and weight (Y) are measured for each individual in a sample.
2. Stock
market valuation (X) and quarterly corporate earnings (Y) are recorded for each
company in a sample.
3. A
cell culture is treated with varying concentrations of a drug and the growth
rate (X) and drug concentrations (Y) are recorded for each trial.
4.
Temperature (X) and precipitation (Y) are measured on a given day at a set of
weather stations.
•There
is difference in bivariate data and two sample data. In two sample data, the X
and Y values are not paired and there are not necessarily the same number of X
and Y values.
• Correlation refers to a relationship
between two or more objects. In statistics, the word correlation refers to the
relationship between two variables. Correlation exists between two variables
when one of them is related to the other in some way.
• Examples: One variable might be the
number of hunters in a region and the other variable could be the deer
population. Perhaps as the number of hunters increases, the deer population
decreases. This is an example of a negative correlation: As one variable
increases, the other decreases.
A positive correlation is
where the two variables react in the same way, increasing or decreasing
together. Temperature in Celsius and Fahrenheit has a positive correlation.
• The
term "correlation" refers to a measure of the strength of association
between two variables.
• Covariance is the extent to which a
change in one variable corresponds systematically to a change in another.
Correlation can be thought of as a standardized covariance.
• The
correlation coefficient r is a function of the data, so it really should be
called the sample correlation coefficient. The (sample) correlation coefficient
r estimates the population correlation coefficient p.
• If
either the X, or the Y; values are constant (i.e. all have the same value),
then one of the sample standard deviations is zero and therefore the
correlation coefficient is not defined.
Types of Correlation
1.
Positive and negative
2.
Simple and multiple
3.
Partial and total
4.
Linear and non-linear.
1. Positive and negative
• Positive correlation :
Association between variables such that high scores on one variable tends to
have high scores on the other variable. A direct relation between the
variables.
• Negative correlation :
Association between variables such that high scores on one variable tends to
have low scores on the other variable. An inverse relation between the
variables.
2. Simple and multiple
• Simple: It is about the study of
only two variables, the relationship is described as simple correlation.
• Example: Quantity of money and price
level, demand and price.
• Multiple: It is about the study of
more than two variables simultaneously, the relationship is described as
multiple correlations.
• Example: The relationship of price,
demand and supply of a commodity.
3. Partial and total correlation
• Partial correlation :
Analysis recognizes more than two variables but considers only two variables
keeping the other constant. Example: Price and demand, eliminating the supply
side.
• Total correlation is based
on all the relevant variables, which is normally not feasible. In total correlation, all the facts are
taken into account.
4. Linear and non-linear correlation
• Linear correlation :
Correlation is said to be linear when the amount of change in one variable
tends to bear a constant ratio to the amount of change in the other. The graph
of the variables having a linear relationship will form a straight line.
• Non linear correlation : The
correlation would be non linear if the amount of change in one variable does
not bear a constant ratio to the amount of change in the other variable.
Classification of correlation
•Two
methods are used for finding relationship between variables.
1. Graphic methods
2. Mathematical methods.
•
Graphic methods contain two sub methods: Scatter
diagram and simple graph.
• Types
of mathematical methods are,
a. Karl 'Pearson's coefficient of correlation
b. Spearman's rank coefficient correlation
c. Coefficient of concurrent deviation
d. Method of least squares.
Coefficient of Correlation
Correlation : The degree of relationship
between the variables under consideration is measure through the correlation
analysis.
• The
measure of correlation called the correlation coefficient. The degree of
relationship is expressed by coefficient which range from correlation (- 1 ≤ r≥ + 1). The direction of
change is indicated by a sign.
• The
correlation analysis enables us to have an idea about the degree and direction
of the relationship between the two variables under study.
•
Correlation is a statistical tool that helps to measure and analyze the degree
of relationship between two variables. Correlation analysis deals with the
association between two or more variables.
•
Correlation denotes the interdependency among the variables for correlating two
phenomenon, it is essential that the two phenomenon should have cause-effect
relationship and if such relationship does not exist then the two phenomenon
can not be correlated.
• If two
variables vary in such a way that movement in one are accompanied by movement
in other, these variables are called cause
and effect relationship.
Properties of Correlation
1.
Correlation requires that both variables be quantitative.
2.
Positive r indicates positive association between the variables and negative r
indicates negative association.
3. The
correlation coefficient (r) is always a number between - 1 and + 1.
4. The
correlation coefficient (r) is a pure number without units.
5. The
correlation coefficient measures clustering about a line, but only relative to
the SD's.
6. The
correlation can be misleading in the presence of outliers or nonlinear
association.
7.
Correlation measures association. But association does not necessarily show
causation.
Example
3.1.1: A sample of 6 children was selected, data about their age in years and
weight in kilograms was recorded as shown in the following table. It is
required to find the correlation between age and weight.
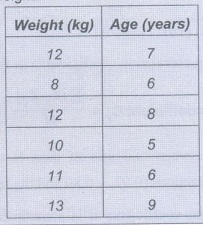
Solution :
X =
Variable age is the independent variable
Y = Variable
weight is the dependent

• Other
formula for calculating correlation coefficient is as follows:
Interpreting the correlation coefficient Cr
= Σ (Zx
Zy)/N
•Because
the relationship between two sets of data is seldom perfect, the majority of
correlation coefficients are fractions (0.92, -0.80 and the like).
• When
interpreting correlation coefficients it is sometimes difficult to determine
what is high, low and average.
• The
value of correlation coefficient 'r' ranges from - 1 to +1.
• If r =
+ 1, then the correlation between the two variables is said to be perfect and
positive.
•If r =
-1, then the correlation between the two variables is said to be perfect and
negative.
• If r =
0, then there exists no correlation between the variables.
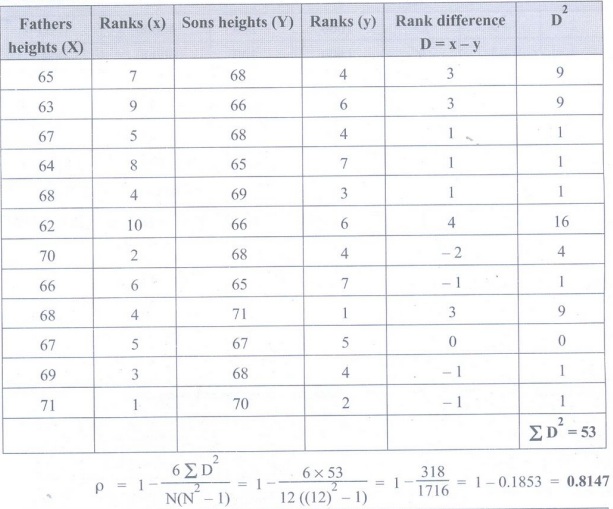
Example 3.1.2: A sample of 12 fathers and their
elder sons gave the following data about their heights in inches. Calculate the
coefficient of rank correlation.
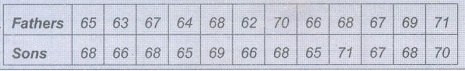
Solution:
Example 3.1.3: Calculate coefficient of
correlation between age of cars and annual maintenance and comment.
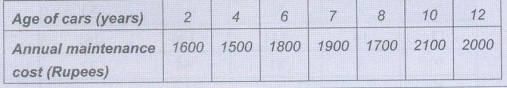
Solution: Let,
x = Age
of cars y= Annual maintenance cost, n = 7
Calculate
X̄ = 2+4+6+ 7+ 8+10+12 / 7 = 49/7= 7
Calculate
Ȳ = 1600+ 1500+ 1800+ 1900+ 1700 + 2100 + 2000
/7
= 12600
/ 7 = 1800
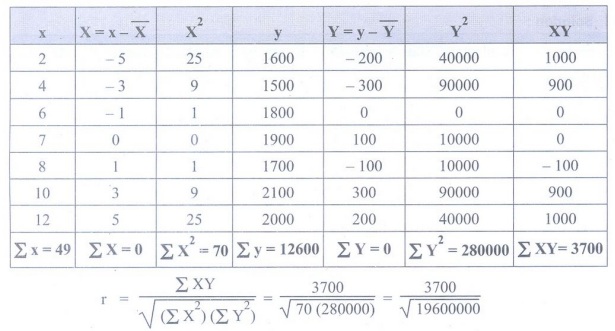
=3700/4427.188
= 0.8357
Coefficient of correlation r = 0.8357
Example 3.1.4: Calculate coefficient of
correlation from the following data.
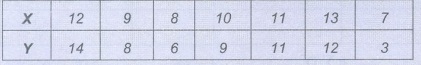
Solution: In the problem statement,
both series items are in small numbers. So there is no need to take deviations.
Computation
of coefficient of correlation
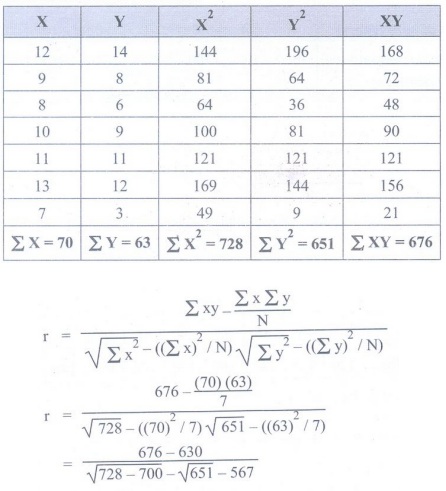
= 46 / 5.29 × 9.165
r = 0.9488
Foundation of Data Science: Unit III: Describing Relationships : Tag: : Types, Coefficient, Properties, Example Solved Problems | Data Science - Correlation
Related Topics
Related Subjects

Foundation of Data Science
CS3352 3rd Semester CSE Dept | 2021 Regulation | 3rd Semester CSE Dept 2021 Regulation