Foundation of Data Science: Unit II: Describing Data
Types of Variables
Describing Data | Data Science
Variable is a characteristic or property that can take on different values.
Types of
Variables
•
Variable is a characteristic or property that can take on different values.
Discrete and Continuous Variables
Discrete
variables:
• Quantitative
variables can be further distinguished in terms of whether they are discrete or
continuous.
• The
word discrete means countable. For example, the number of students in a class
is countable or discrete. The value could be 2, 24, 34 or 135 students, but it
cannot be 23/32 or 12.23 students.
• Number
of page in the book is a discrete variable. Discrete data can only take on
certain individual values.
Continuous variables:
• Continuous
variables are a variable which can take all values within a given interval or
range. A continuous variable consists of numbers whose values, at least in
theory, have no restrictions.
•
Example of continuous variables is Blood pressure, weight, high and income.
•
Continuous data can take on any value in a certain range. Length of a file is a
continuous variable.
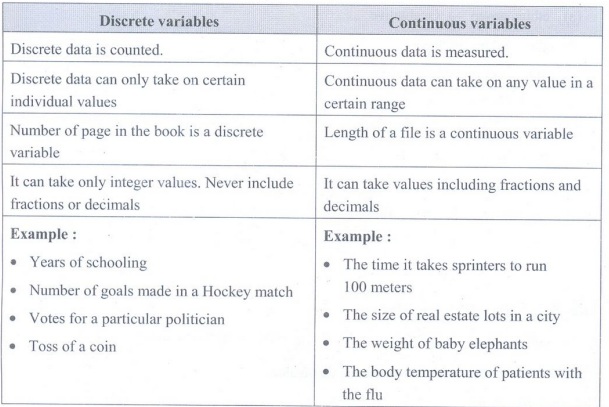
Difference between Discrete variables and Continuous variables
Approximate Numbers
• Approximate
number is defined as a number approximated to the exact number and there is
always a difference between the exact and approximate numbers.
• For
example, 2, 4, 9 are exact numbers as they do not need any approximation.
• But √2, л, √3 are approximate numbers as
they cannot be expressed exactly by a finite digits. They can be written as
1.414, 3.1416, 1.7320 etc which are only approximations to the true values.
• Whenever
values are rounded off, as is always the case with actual values for continuous
variables, the resulting numbers are approximate, never exact.
• An
approximate number is one that does have uncertainty. A number can be
approximate for one of two reasons:
a) The
number can be the result of a measurement.
b)
Certain numbers simply cannot be written exactly in decimal form. Many
fractions and all irrational numbers fall into this category
Independent and Dependent Variables
• The
two main variables in an experiment are the independent and dependent variable.
An experiment is a study in which the investigator decides who receives the
special treatment.
1.
Independent variables
• An
independent variable is the variable that is changed or controlled in a
scientific experiment to test the effects on the dependent variable.
• An
independent variable is a variable that represents a quantity that is being
manipulated in an experiment.
• The
independent variable is the one that the researcher intentionally changes or
controls.
• In an experiment, an independent variable is
the treatment manipulated by the investigator. Mostly in mathematical
equations, independent variables are denoted by 'x'.
•
Independent variables are also termed as "explanatory variables,"
"manipulated variables," or "controlled variables." In a
graph, the independent variable is usually plotted on the X-axis.
2. Dependent variables
• A
dependent variable is the variable being tested and measured in a scientific
experiment.
• The
dependent variable is 'dependent' on the independent variable. As the
experimenter changes the independent variable, the effect on the dependent
variable is observed and recorded.
• The
dependent variable is the factor that the research measures. It changes in
response to the independent variable or depends upon it.
• A
dependent variable represents a quantity whose value depends on how the
independent variable is manipulated.
• Mostly
in mathematical equations, dependent variables are denoted by 'y'.
• Dependent
variables are also termed as "measured variable," the
"responding variable," or the "explained variable". In a
graph, dependent variables are usually plotted on the Y-axis.
• When a
variable is believed to have been influenced by the independent variable, it is
called a dependent variable. In an experimental setting, the dependent variable
is measured, counted or recorded by the investigator.
• Example:
Suppose we want to know whether or not eating breakfast affects student test
scores. The factor under the experimenter's control is the presence or absence
of breakfast, so we know it is the independent variable. The experiment
measures test scores of students who ate breakfast versus those who did not.
Theoretically, the test results depend on breakfast, so the test results are
the dependent variable. Note that test scores are the dependent variable, even
if it turns out there is no relationship between scores and breakfast.
Observational Study
• An
observational study focuses on detecting relationships between variables not
manipulated by the investigator. An observational study is used to answer a
research question based purely on what the researcher observes. There is no
interference or manipulation of the research subjects and no control and
treatment groups.
• These
studies are often qualitative in nature and can be used for both exploratory
and explanatory research purposes. While quantitative observational studies
exist, they are less common.
•
Observational studies are generally used in hard science, medical and social
science fields. This is often due to ethical or practical concerns that prevent
the researcher from conducting a traditional experiment. However, the lack of
control and treatment groups means that forming inferences is difficult and
there is a risk of confounding variables impacting user analysis.
Confounding Variable
• Confounding
variables are those that affect other variables in a way that produces spurious
or distorted associations between two variables. They confound the
"true" relationship between two variables. Confounding refers to
differences in outcomes that occur because of differences in the baseline risks
of the comparison groups.
• For
example, if we have an association between two variables (X and Y) and that
association is due entirely to the fact that both X and Y are affected by a
third variable (Z), then we would say that the association between X and Y is
spurious and that it is a result of the effect of a confounding variable (Z).
• A
difference between groups might be due not to the independent variable but to a
confounding variable.
• For a
variable to be confounding:
a) It
must have connected with independent variables of interest and
b) It
must be connected to the outcome or dependent variable directly.
•
Consider the example, in order to conduct research that has the objective that
alcohol drinkers can have more heart disease than non-alcohol drinkers such that
they can be influenced by another factor. For instance, alcohol drinkers might
consume cigarettes more than non drinkers that act as a confounding variable
(consuming cigarettes in this case) to study an association amidst drinking
alcohol and heart disease.
• For
example, suppose a researcher collects data on ice cream sales and shark
attacks and finds that the two variables are highly correlated. Does this mean
that increased ice cream sales cause more shark attacks? That's unlikely. The
more likely cause is the confounding variable temperature. When it is warmer
outside, more people buy ice cream and more people go in the ocean.
Foundation of Data Science: Unit II: Describing Data : Tag: : Describing Data | Data Science - Types of Variables
Related Topics
Related Subjects

Foundation of Data Science
CS3352 3rd Semester CSE Dept | 2021 Regulation | 3rd Semester CSE Dept 2021 Regulation