Foundation of Data Science: Unit II: Describing Data
Normal Distributions and Standard (z) Scores
Describing Data | Data Science
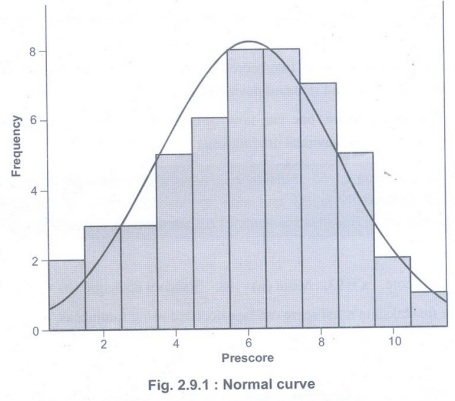
The normal distribution is a continuous probability distribution that is symmetrical on both sides of the mean, so the right side of the center is a mirror image of the left side.
Normal Distributions and Standard
(z) Scores
• The
normal distribution is a continuous probability distribution that is
symmetrical on both sides of the mean, so the right side of the center is a
mirror image of the left side. The area under the normal distribution curve
represents probability and the total area under the curve sums to one.
• The
normal distribution is often called the bell curve because the graph of its
probability density looks like a bell. It is also known as called Gaussian
distribution, after the German mathematician Carl Gauss who first described it.
• Fig.
2.9.1 shows normal curve.
• A
normal distribution is determined by two parameters the mean and the variance.
A normal distribution with a mean of 0 and a standard deviation of 1 is called
a standard normal distribution.
z Scores
• The
Z-score or standard score, is a fractional representation of standard
deviations from the mean value. Accordingly, z-scores often have a distribution
with no average and standard deviation of 1. Formally, the z-score is defined
as :
Z = X-μ / σ
where μ is mean, X is score and σ is standard deviation
• The
z-score works by taking a sample score and subtracting the mean score, before
then dividing by the standard deviation of the total population. The z-score is
positive if the value lies above the mean and negative if it lies below the
mean.
• A z
score consists of two parts:
a)
Positive or negative sign indicating whether it's above or below the mean; and
b)
Number indicating the size of its deviation from the mean in standard deviation
units
• Why are z-scores important?
• It is
useful to standardized the values (raw scores) of a normal distribution by
converting them into z-scores because:
(a) It allows researchers to calculate the
probability of a score occurring within a standard normal distribution;
(b) And
enables us to compare two scores that are from different samples (which may
have different means and standard deviations).
• Using
the z-score technique, one can now compare two different test results based on
relative performance, not individual grading scale.
Example 2.9.1: A class of 50 students who have
written the science test last week. Rakshita student scored 93 in the test
while the average score of the class was 68. Determine the z-score for
Rakshita's test mark if the standard deviation is 13.
Solution: Given,
Rakshita's
test score, x = 93, Mean (u) = 68, Standard deviation (σ) = 13 The z-score for
Rakshita's test score can be calculated using formula as,
Ꮓ
= X- μ / σ = 93-68
/ 13 = 1.923
Example 2.9.2: Express each of the following
scores as a z score:
(a) Margaret's IQ of 135, given a mean of 100
and a standard deviation of 15
(b) A score of 470 on the SAT math test, given
a mean of 500 and a standard deviation of 100.
Solution :
a) Margaret's IQ of 135, given a mean of 100
and a standard deviation of 15
Given,
Margaret's IQ (X) = 135, Mean (u) = 100, Standard deviation (o) = 15
The
z-score for Margaret's calculated using formula as,
Z = X- μ / σ = 135-100 / 15 =2.33
b) A score of 470 on the SAT math test, given a
mean of 500 and a standard deviation of 100
Given,
Score
(X) = 470, Mean (u) = 500, Standard deviation (6)= 100
The
z-score for Margaret's calculated using formula as,
Z = X-μ / σ = 470-500
/100 = 0.33
Standard Normal Curve
• If the
original distribution approximates a normal curve, then the shift to standard
or z-scores will always produce a new distribution that approximates the
standard normal curve.
•
Although there is an infinite number of different normal curves, each with its
own mean and standard deviation, there is only one standard normal curve, with
a mean of 0 and a standard deviation of 1.
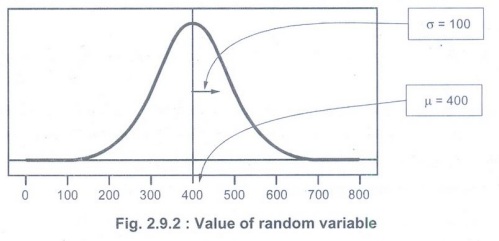
Example 2.9.3: Suppose a random variable is
normally distributed with a mean of 400 and a standard deviation 100. Draw a
normal curve with parameter label.
Solution:
Foundation of Data Science: Unit II: Describing Data : Tag: : Describing Data | Data Science - Normal Distributions and Standard (z) Scores
Related Topics
Related Subjects

Foundation of Data Science
CS3352 3rd Semester CSE Dept | 2021 Regulation | 3rd Semester CSE Dept 2021 Regulation