Foundation of Data Science: Unit II: Describing Data
Misleading Graph
Describing Data | Data Science
It is a well known fact that statistics can be misleading. They are often used to prove a point and can easily be twisted in favour of that point.
Misleading
Graph
• It is
a well known fact that statistics can be misleading. They are often used to
prove a point and can easily be twisted in favour of that point.
• Good
graphs are extremely powerful tools for displaying large quantities of complex
data; they help turn the realms of information available today into knowledge.
But, unfortunately, some graphs deceive or mislead.
• This
may happen because the designer chooses to give readers the impression of
better performance or results than is actually the situation. In other cases,
the person who prepares the graph may want to be accurate and honest, but may
mislead the reader by a poor choice of a graph form or poor graph construction.
• The
following things are important to consider when looking at a graph:
1. Title
2.
Labels on both axes of a line or bar chart and on all sections of a pie chart
3.
Source of the data
4. Key
to a pictograph
5.
Uniform size of a symbol in a pictograph
6.
Scale: Does it start with zero? If not, is there a break shown
7.
Scale: Are the numbers equally spaced?
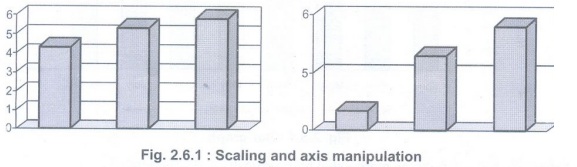
• A
graph can be altered by changing the scale of the graph. For example, data in
the two graphs of Fig. 2.6.1 are identical, but scaling of the Y-axis changes
the impression of the magnitude of differences.
Example 2.6.1: Construct a frequency
distribution for the number of different residences occupied by graduating
seniors during their college career, namely: 1, 4, 2, 3, 3, 1, 6, 7, 4, 3, 3,
9, 2, 4, 2, 2, 3, 2, 3, 4, 4, 2, 3, 3, 5. What is the shape of this
distribution?
Solution:
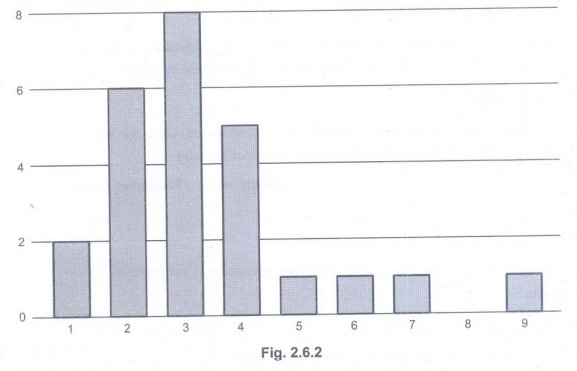
Normal distribution: The
normal distribution is one of the most commonly encountered types of data
distribution, especially in social sciences. Due to its bell-like shape, the
normal distribution is also referred to as the bell curve.
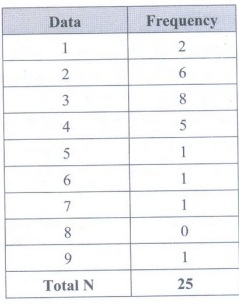
Histogram of given data:
Foundation of Data Science: Unit II: Describing Data : Tag: : Describing Data | Data Science - Misleading Graph
Related Topics
Related Subjects

Foundation of Data Science
CS3352 3rd Semester CSE Dept | 2021 Regulation | 3rd Semester CSE Dept 2021 Regulation