Foundation of Data Science: Unit V: Data Visualization
Legend
Matplotlib | Data Visualization
Plot legends give meaning to a visualization, assigning labels to the various plot elements.
Legend
• Plot
legends give meaning to a visualization, assigning labels to the various plot
elements. Legends are found in maps - describe the pictorial language or
symbology of the map. Legends are used in line graphs to explain the function
or the values underlying the different lines of the graph.
•
Matplotlib has native support for legends. Legends can be placed in various
positions: A legend can be placed inside or outside the chart and the position
can be moved. The legend() method adds the legend to the plot.
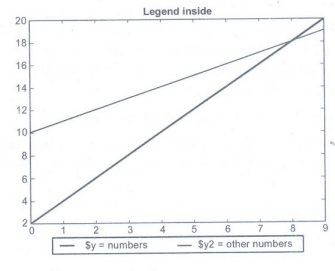
• To
place the legend inside, simply call legend():
import
matplotlib.pyplot as plt
import
numpy as np
y =
[2,4,6,8,10,12,14,16,18,20]
y2 = [10,11,12,13,14,15,16,17,18,19]
x =
np.arange(10)
fig =
plt.figure()
ax =
plt.subplot(111)
ax.plot(x,
y, label='$y = numbers')
ax.plot(x,
y2, label='$y2 = other numbers')
plt.title('Legend
inside')
ax.legend()
plt.show()
Output:

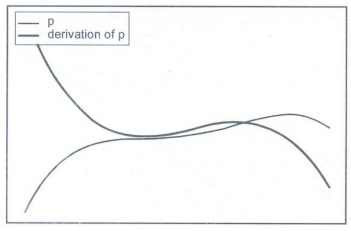
• If we
add a label to the plot function, the value will be used as the label in the
legend command. There is another argument that we can add to the legend
function: We can define the location of the legend inside of the axes plot with
the parameter "loc". If we add a label to the plot function, the
values will be used in the legend command:
frompolynomialsimportPolynomial
importnumpyasnp
importmatplotlib.pyplotasplt
p=Polynomial(-0.8,2.3,0.5,1,0.2)
p_der=p.derivative()
fig,
ax=plt.subplots()
X=np.linspace
(-2,3,50, endpoint=True)
F=p(X)
F_derivative=p_der(X)
ax.plot(X,F,label="p")
ax.plot(X,F_derivative,label="derivation
of p")
ax.legend(loc='upper
left')
Output:
Matplotlib legend on bottom
importmatplotlib.pyplotasplt
importnumpyasnp
y1 =
[2,4,6,8,10,12,14,16,18,20]
y2 =
[10,11,12,13,14,15,16,17,18,19]
x =
np.arange(10)
fig =
plt.figure()
ax = plt.subplot(111)
ax.plot(x,
y, label='$y = numbers')
ax.plot(x,
y2, label='$y2= = other numbers')
plt.title('Legend
inside')
ax.legend(loc='upper
center', bbox_to_anchor=(0.5, -0.05),
shadow=True,
ncol=2)
plt.show()
Output:
Foundation of Data Science: Unit V: Data Visualization : Tag: : Matplotlib | Data Visualization - Legend
Related Topics
Related Subjects

Foundation of Data Science
CS3352 3rd Semester CSE Dept | 2021 Regulation | 3rd Semester CSE Dept 2021 Regulation