Foundation of Data Science: Unit II: Describing Data
Describing Variability
Data Science
Variability refers to the divergence of data from its mean value and is commonly used in the statistical and financial sectors.
Describing
Variability
•
Variability, almost by definition, is the extent to which data points in a
statistical distribution or data set diverge, vary from the average value, as
well as the extent to which these data points differ from each other.
Variability refers to the divergence of data from its mean value and is
commonly used in the statistical and financial sectors.
• The
goal for variability is to obtain a measure of how spread out the scores are in
a distribution. A measure of variability usually accompanies a measure of
central tendency as basic descriptive statistics for a set of scores.
•
Central tendency describes the central point of the distribution and
variability describes how the scores are scattered around that central point.
Together, central tendency and variability are the two primary values that are
used to describe a distribution of scores.
•
Variability serves both as a descriptive measure and as an important component
of most inferential statistics. As a descriptive statistic, variability measures
the degree to which the scores are spread out or clustered together in a
distribution.
•
Variability can be measured with the range, the interquartile range and the
standard deviation/variance. In each case, variability is determined by
measuring distance.
Range
• The
range is the total distance covered by the distribution, from the highest score
to the lowest score (using the upper and lower real limits of the range).
Range=Maximum value - Minimum value
Merits :
a) It is
easier to compute.
b) It
can be used as a measure of variability where precision is not required. Demerits :
a) Its
value depends on only two scores
b) It is
not sensitive to total condition of the distribution.
Variance
• Variance is the expected
value of the squared deviation of a random variable from its mean. In short, it
is the measurement of the distance of a set of random numbers from their
collective average value. Variance is used in statistics as a way of better
understanding a data set's distribution.
• Variance
is calculated by finding the square of the standard deviation of a variable.
σ2= Σ(Χ - μ)2 /N
• In the
formula above, μ
represents the mean of the data points, x is the value of an individual data
point and N is the total number of data points.
• Data
scientists often use variance to better understand the distribution of a data
set. Machine learning uses variance calculations to make generalizations about
a data set, aiding in a neural network's understanding of data distribution.
Variance is often used in conjunction with probability distributions.
Standard Deviation
• Standard
deviation is simply the square root of the variance. Standard deviation
measures the standard distance between a score and the mean.
Standard deviation=√Variance
• The
standard deviation is a measure of how the values in data differ from one
another or how spread out data is. There are two types of variance and standard
deviation in terms of sample and population.
• The
standard deviation measures how far apart the data points in observations are
from each. we can calculate it by subtracting each data point from the mean
value and then finding the squared mean of the differenced values; this is
called Variance. The square root of the variance gives us the standard
deviation.
•
Properties of the Standard Deviation :
a) If a
constant is added to every score in a distribution, the standard deviation will
not be changed.
b) The
center of the distribution (the mean) changes, but the standard deviation
remains the same.
c) If
each score is multiplied by a constant, the standard deviation will be
multiplied by the same constant.
d)
Multiplying by a constant will multiply the distance between scores and because
the standard deviation is a measure of distance, it will also be multiplied.
• If
user are given numerical values for the mean and the standard deviation, we should
be able to construct a visual image (or a sketch) of the distribution of
scores. As a general rule, about 70% of the scores will be within one standard
deviation of the mean and about 95% of the scores will be within a distance of
two standard deviations of the mean.
• The
mean is a measure of position, but the standard deviation is a measure of
distance (on either side of the mean of the distribution).
•
Standard deviation distances always originate from the mean and are expressed
as positive deviations above the mean or negative deviations below the mean.
• Sum of
Square (SS) for population definition formula is given below:
Sum of Square (SS) = Σ(x-μ)2
• Sum of
Square (SS) for population computation formula is given below:
SS= ΣΧ2- (ΣΧ)2/ N
• Sum of
Squares for sample definition formula:
SS = Σ (X-X̄)2
• Sum of
Squares for sample computation formula :
SS = Σx2 - (Σx)2/n
Example 2.8.1: The heights of animals are: 600
mm, 470 mm, 170 mm, 430 mm and 300 mm. Find out the mean, the variance and the
standard deviation.
Solution:
Mean = 600+
470 + 170+ 430 + 300 / 5
=1970
/5= 394
σ2= Σ(Χ - μ)2/ N
Variance
= (600-394)2 + (470-394)2 + (170-394)2 + (430-394)2
+ (300-394)2 /5
Variance
= 42436+5776+ 50176 + 1296 +8836 / 5
Variance
= 21704
Standard
deviation = √Variance = √21704
= 142.32
≈
142
Example 2.8.2: Using the computation formula
for the sum of squares, calculate the population standard deviation for the
scores: 1, 3, 7, 2, 0, 4, 7, 3.
Solution: Calculate mean of data
Mean = 1+3+7+2+0+4+7+3
/ 8 = 3.375
Variance
= (3.375-1)2 + (3.375-3)2 + (3.375-7)2 +
(3.375-2)2 + (3.375-0)2 + (3.375−4)2
+ (3.375 − 7)2 + (3.375 – 3)2 /8
= (-2.375)2
+ (0.375)2 + (3.625)2 + (−1.375)2
+ (-3.375)2 + (0.625)2 + (3.625)2 + (−0.375)2
/8
= 5.64+0.14+13.14+1.89+11.39+0.39+13.14+0.14
/8
= 45.87 /8
= 5.73
Variance
= 5.73
The
population standard deviation is the square root of the variance = (5.73)1/2
= 2.393
The Interquartile Range
• The interquartile range is the distance
covered by the middle 50% of the distribution (the difference between Q1 and
Q3).
• Fig.
2.8.1 shows IQR.
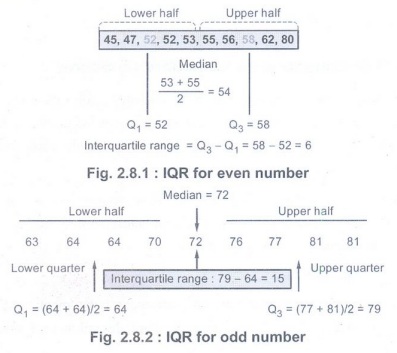
• The
first quartile, denoted Q1, is the value in the data set that holds 25% of the
values below it. The third quartile, denoted Q3, is the value in the data set
that holds 25% of the values above it.
Example 2.8.3: Determine the values of the
range and the IQR for the following sets of data.
(a) Retirement ages: 60, 63,
45, 63, 65, 70, 55, 63, 60, 65, 63
(b) Residence changes: 1, 3,
4, 1, 0, 2, 5, 8, 0, 2, 3, 4, 7, 11, 0, 2, 3, 4
Solution:
a) Retirement ages: 60,
63, 45, 63, 65, 70, 55, 63, 60, 65, 63
Range =
Max number - Min number = 70-45
Range = 25
IQR:
Step 1: Arrange given number form lowest to
highest.
45, 55, 60, 60, 63, 63, 63, 63, 65, 65, 70
↑
Median
Q1=60 , Q3 65
IQR = Q3-Q1=65-60
= 5
Foundation of Data Science: Unit II: Describing Data : Tag: : Data Science - Describing Variability
Related Topics
Related Subjects

Foundation of Data Science
CS3352 3rd Semester CSE Dept | 2021 Regulation | 3rd Semester CSE Dept 2021 Regulation