Foundation of Data Science: Unit IV: Python Libraries for Data Wrangling
Data Manipulation with Pandas
Python Libraries for Data Wrangling
Pandas is a high-level data manipulation tool developed by Wes McKinney. It is built on the Numpy package and its key data structure is called the DataFrame.
Data Manipulation with Pandas
• Pandas
is a high-level data manipulation tool developed by Wes McKinney. It is built
on the Numpy package and its key data structure is called the DataFrame.
• DataFrames
allow you to store and manipulate tabular data in rows of observations and
columns of variables.
• Pandas
is built on top of the NumPy package, meaning a lot of the structure of NumPy
is used or replicated in Pandas. Data in pandas is often used to feed
statistical analysis in SciPy, plotting functions from Matplotlib and machine
learning algorithms in Scikit-learn.
• Pandas
is the library for data manipulation and analysis. Usually, it is the starting
point for your data science tasks. It allows you to read/write data from/to
multiple sources. Process the missing data, align your data, reshape it, merge
and join it with other data, search data, group it, slice it.
Create DataFrame with Duplicate Data
• Duplicate
data creates the problem for data science project. If database is large, then
processing duplicate data means wastage of time.
• Finding
duplicates is important because it will save time, space false result. how to
easily and efficiently you can remove the duplicate data using
drop_duplicates() function in pandas.
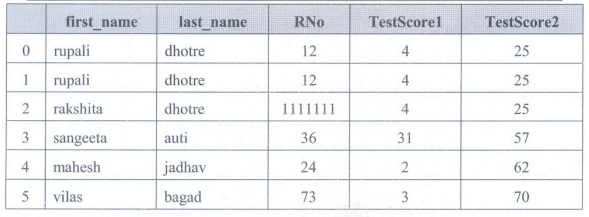
• Create
Dataframe with Duplicate data
import pandas as pd
raw_data={'first_name': ['rupali',
'rupali', 'rakshita','sangeeta', 'mahesh', 'vilas'],
'last_name': ['dhotre', 'dhotre',
'dhotre','Auti', 'jadhav', 'bagad'],
'RNo': [12, 12, 1111111, 36, 24, 73],
'TestScore1':
[4, 4, 4, 31, 2, 3],
'TestScore2': [25, 25, 25, 57, 62, 70]}
df =
pd.DataFrame(raw_data, columns = ['first_name', 'last_name', 'age',
'preTestScore', 'postTestScore'])
df
Drop duplicates
df.drop_duplicates()
• Drop duplicates
in the first name column, but take the last observation in the duplicated set
df.drop_duplicates
(['first_name'], keep='last')
Creating a Data Map and Data Plan
• Overview
of dataset is given by data map. Data map is used for finding potential
problems in data, such as redundant variables, possible errors, missing values
and variable transformations.
• Try
creating a Python script that converts a Python dictionary into a Pandas
DataFrame, then print the DataFrame to screen.
import pandas as pd
scottish_hills={'Ben Nevis': (1345, 56.79685,
-5.003508),
'Ben Macdui': (1309, 57.070453, -3.668262),
'Braeriach': (1296, 57.078628, -3.728024),
'Cairn Toul': (1291, 57.054611, -3.71042),
'Sgòr an Lochain Uaine': (1258, 57.057999,
-3.725416)}
dataframe = pd.DataFrame(scottish_hills)
print(dataframe)
Manipulating and Creating Categorical Variables
• Categorical
variable is one that has a specific value from a limited selection of values.
The number of values is usually fixed.
• Categorical
features can only take on a limited, and usually fixed, number of possible
values. For example, if a dataset is about information related to users, then
you will typically find features like country, gender, age group, etc.
Alternatively, if the data you are working with is related to products, you
will find features like product type, manufacturer, seller and so on.
• Method
for creating a categorical variable and then using it to check whether some
data falls within the specified limits.
import pandas
as pd
cycle_colors=pd.Series(['Blue',
'Red', 'Green'], dtype='category')
cycle_data
= pd.Series( pd.Categorical(['Yellow', 'Green', 'Red', 'Blue', 'Purple'],
categories=cycle_colors, ordered=False))
find_entries
= pd.isnull(cycle_data)
print
cycle_colors
print
print
cycle_data
print
print
find_entries [find_entries==True]
• Here
cycle_color is a categorical variable. It contains the values Blue, Red, and
Green as color.
Renaming Levels and Combining Levels
• Data
frame variable names are typically used many times when wrangling data. Good
names for these variables make it easier to write and read wrangling programs.
• Categorical
data has a categories and a ordered property, which list their possible values
and whether the ordering matters or not.
•
Renaming categories is done by assigning new values to the
Series.cat.categories property or by using the Categorical.rename_categories()
method :
In [41]:
s = pd.Series(["a","b","c","a"],
dtype="category")
In [41]:
s
Out[43]:
0 a
1 b
2 C
3 a
dtype:
category
Categories
(3, object): [a, b, c]
In [44]:
s.cat.categories=["Group %s" % g for g in s.cat.categories]
In [45]:
s
Out[45]:
0 Group a
1 Group b
2 Group c
3 Group a
dtype:
category
Categories
(3, object): [Group a, Group b, Group c]
In [46]:
s.cat.rename_categories([1,2,3])
Out[46]:
0 1
1 2
2 3
3 1
dtype:
category
Categories
(3, int64): [1, 2, 3]
Dealing with Dates and Times Values
• Dates
are often provided in different formats and must be converted into single format
Date Time objects before analysis.
• Python
provides two methods of formatting date and time.
1. str()
= It turns a datetime value into a string without any formatting.
2.
strftime() function= It define how user want the datetime value to appear after
conversion.
1. Using pandas.to_datetime() with a date
import
pandas as pd
#input
in mm.dd.yyyy format
date =
['21.07.2020']
# output
in yyyy-mm-dd format
print(pd.to_datetime(date))
2. Using pandas.to_datetime() with a date and
time
import
pandas as pd
# date
(mm.dd.yyyy) and time (H:MM:SS)
date
[21.07.2020 11:31:01 AM']
# output
in yyyy-mm-dd HH:MM:SS
print(pd.to_datetime(date))
• We can
convert a string to datetime using strptime() function. This function is
available in datetime and time modules to parse a string to datetime and time
objects respectively.
• Python
strptime() is a class method in datetime class. Its syntax is :
datetime.strptime(date_string, format)
• Both
the arguments are mandatory and should be string
import
datetime
format="%a
%b %d %H:%M:%S %Y"
today =
datetime.datetime.today()
print
'ISO:', today
s =
today.strftime(format)
print
'strftime:', s
d =
datetime.datetime.strptime(s, format)
print
'strptime:', d.strftime(format)
$ python
datetime_datetime_strptime.py
ISO : 2013-02-21
06:35:45.707450
strftime:
Thu Feb 21 06:35:45 2013
strptime:
Thu Feb 21 06:35:45 2013
• Time Zones: Within datetime, time zones
are represented by subclasses of tzinfo. Since tzinfo is an abstract base
class, you need to define a subclass and provide appropriate implementations
for a few methods to make it useful.
Missing Data
• Data
can have missing values for a number of reasons such as observations that were
not recorded and data corruption. Handling missing data is important as many machine
learning algorithms do not support data with missing values.
• You
can load the dataset as a Pandas DataFrame and print summary statistics on each
attribute.
# load
and summarize the dataset
from
pandas import read_csv
# load
the dataset
dataset
= read_csv('csv file name', header=None)
#
summarize the dataset
print(dataset.describe())
• In
Python, specifically Pandas, NumPy and Scikit-Learn, we mark missing values as
NaN. Values with a NaN value are ignored from operations like sum, count, etc.
• Use the
isnull() method to detect the missing values. Pandas Dataframe provides a
function isnull(), it returns a new dataframe of same size as calling
dataframe, it contains only True and False only. With True at the place NaN in
original dataframe and False at other places.
Encoding
missingness:
• The
fillna() function is used to fill NA/NaN values using the specified method.
• Syntax
:
DataFrame.fillna(value=None, method=None,
axis=None, inplace=False, limit=None, downcast=None,
**kwargs)
Where
1. value:
It is a value that is used to fill the null values.
2.
method: A method that is used to fill the null values.
3. axis:
It takes int or string value for rows/columns.
4.
inplace: If it is True, it fills values at an empty place.
5.
limit: It is an integer value that specifies the maximum number of consecutive
forward/backward NaN value fills.
6.
downcast: It takes a dict that specifies what to downcast like Float64 to
int64.
Foundation of Data Science: Unit IV: Python Libraries for Data Wrangling : Tag: : Python Libraries for Data Wrangling - Data Manipulation with Pandas
Related Topics
Related Subjects

Foundation of Data Science
CS3352 3rd Semester CSE Dept | 2021 Regulation | 3rd Semester CSE Dept 2021 Regulation